About this Add-on
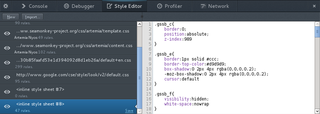
You can connect to the debugger server from a corresponding version of Firefox. (Using other versions of Firefox may only work partially or not at all.) Open chrome://browser/content/devtools/connect.xhtml and click Connect. SeaMonkey will then prompt you to confirm the connection.
You will then see a list of tabs to connect to, plus a "Main Process" option that allows you to access the chrome debugger. After you make your choice, Firefox's Developer Tools will open in a new window, allowing you to start debugging.
Note: the "Main Process" option will allow you to debug the entire SeaMonkey process, but the Web Console can only connect to the most recent navigator window, if any, while the Style Editor only works with content tabs, so you may prefer to use the Error Console and DOM Inspector in the meantime.
Known issues: The debugger server does not work properly if you have any untitled tabs open. This issue is being tracked in Bugzilla bug 889352.
![[Warning]](https://addons.thunderbird.net/static/img/developers/test-warning.png?b=58a99cbb-667a0970) Permissions
Permissions

